
Want to know when to list your home for the best (and worst) price possible? My Home Move has the answer…
February 8, 2016- Homes listed in May achieve top sales price for sellers
- (Early) winter months offer worst return for homesellers
- Average property prices vary by £69,000 between summer and winter sales across Greater London (2015)
- North East and Wales buck the trend – showing no pattern of when to list for top prices
Property sellers wanting to achieve the best price possible should look to list their homes for sale during the spring months and in particular May, according to research by My Home Move, the UK’s leading provider of mover conveyancing services.
Analysing over 60,000 of its sales records from 2013 to 2015, My Home Move took the average property price achieved for each region and compared the results across the months and years, including looking back to when, on average, properties were listed, to determine the trends for when movers should look to sell their homes.*
The analysis also highlighted the least successful months in which to list a property. Homes listed in October, November and December achieved the lowest prices on average over the three years; resulting in a variation of £69,000 for properties sold in Greater London during 2015**.
Commenting on these results, Doug Crawford, CEO of My Home Move, said:
“While we appreciate that there are many reasons driving when people choose to list their home for sale, we know that every seller wants to secure the best price possible for their property. So we have developed our regionalised ‘movers’ maps’, to help identify the best (and worst) times for sellers to list their homes.
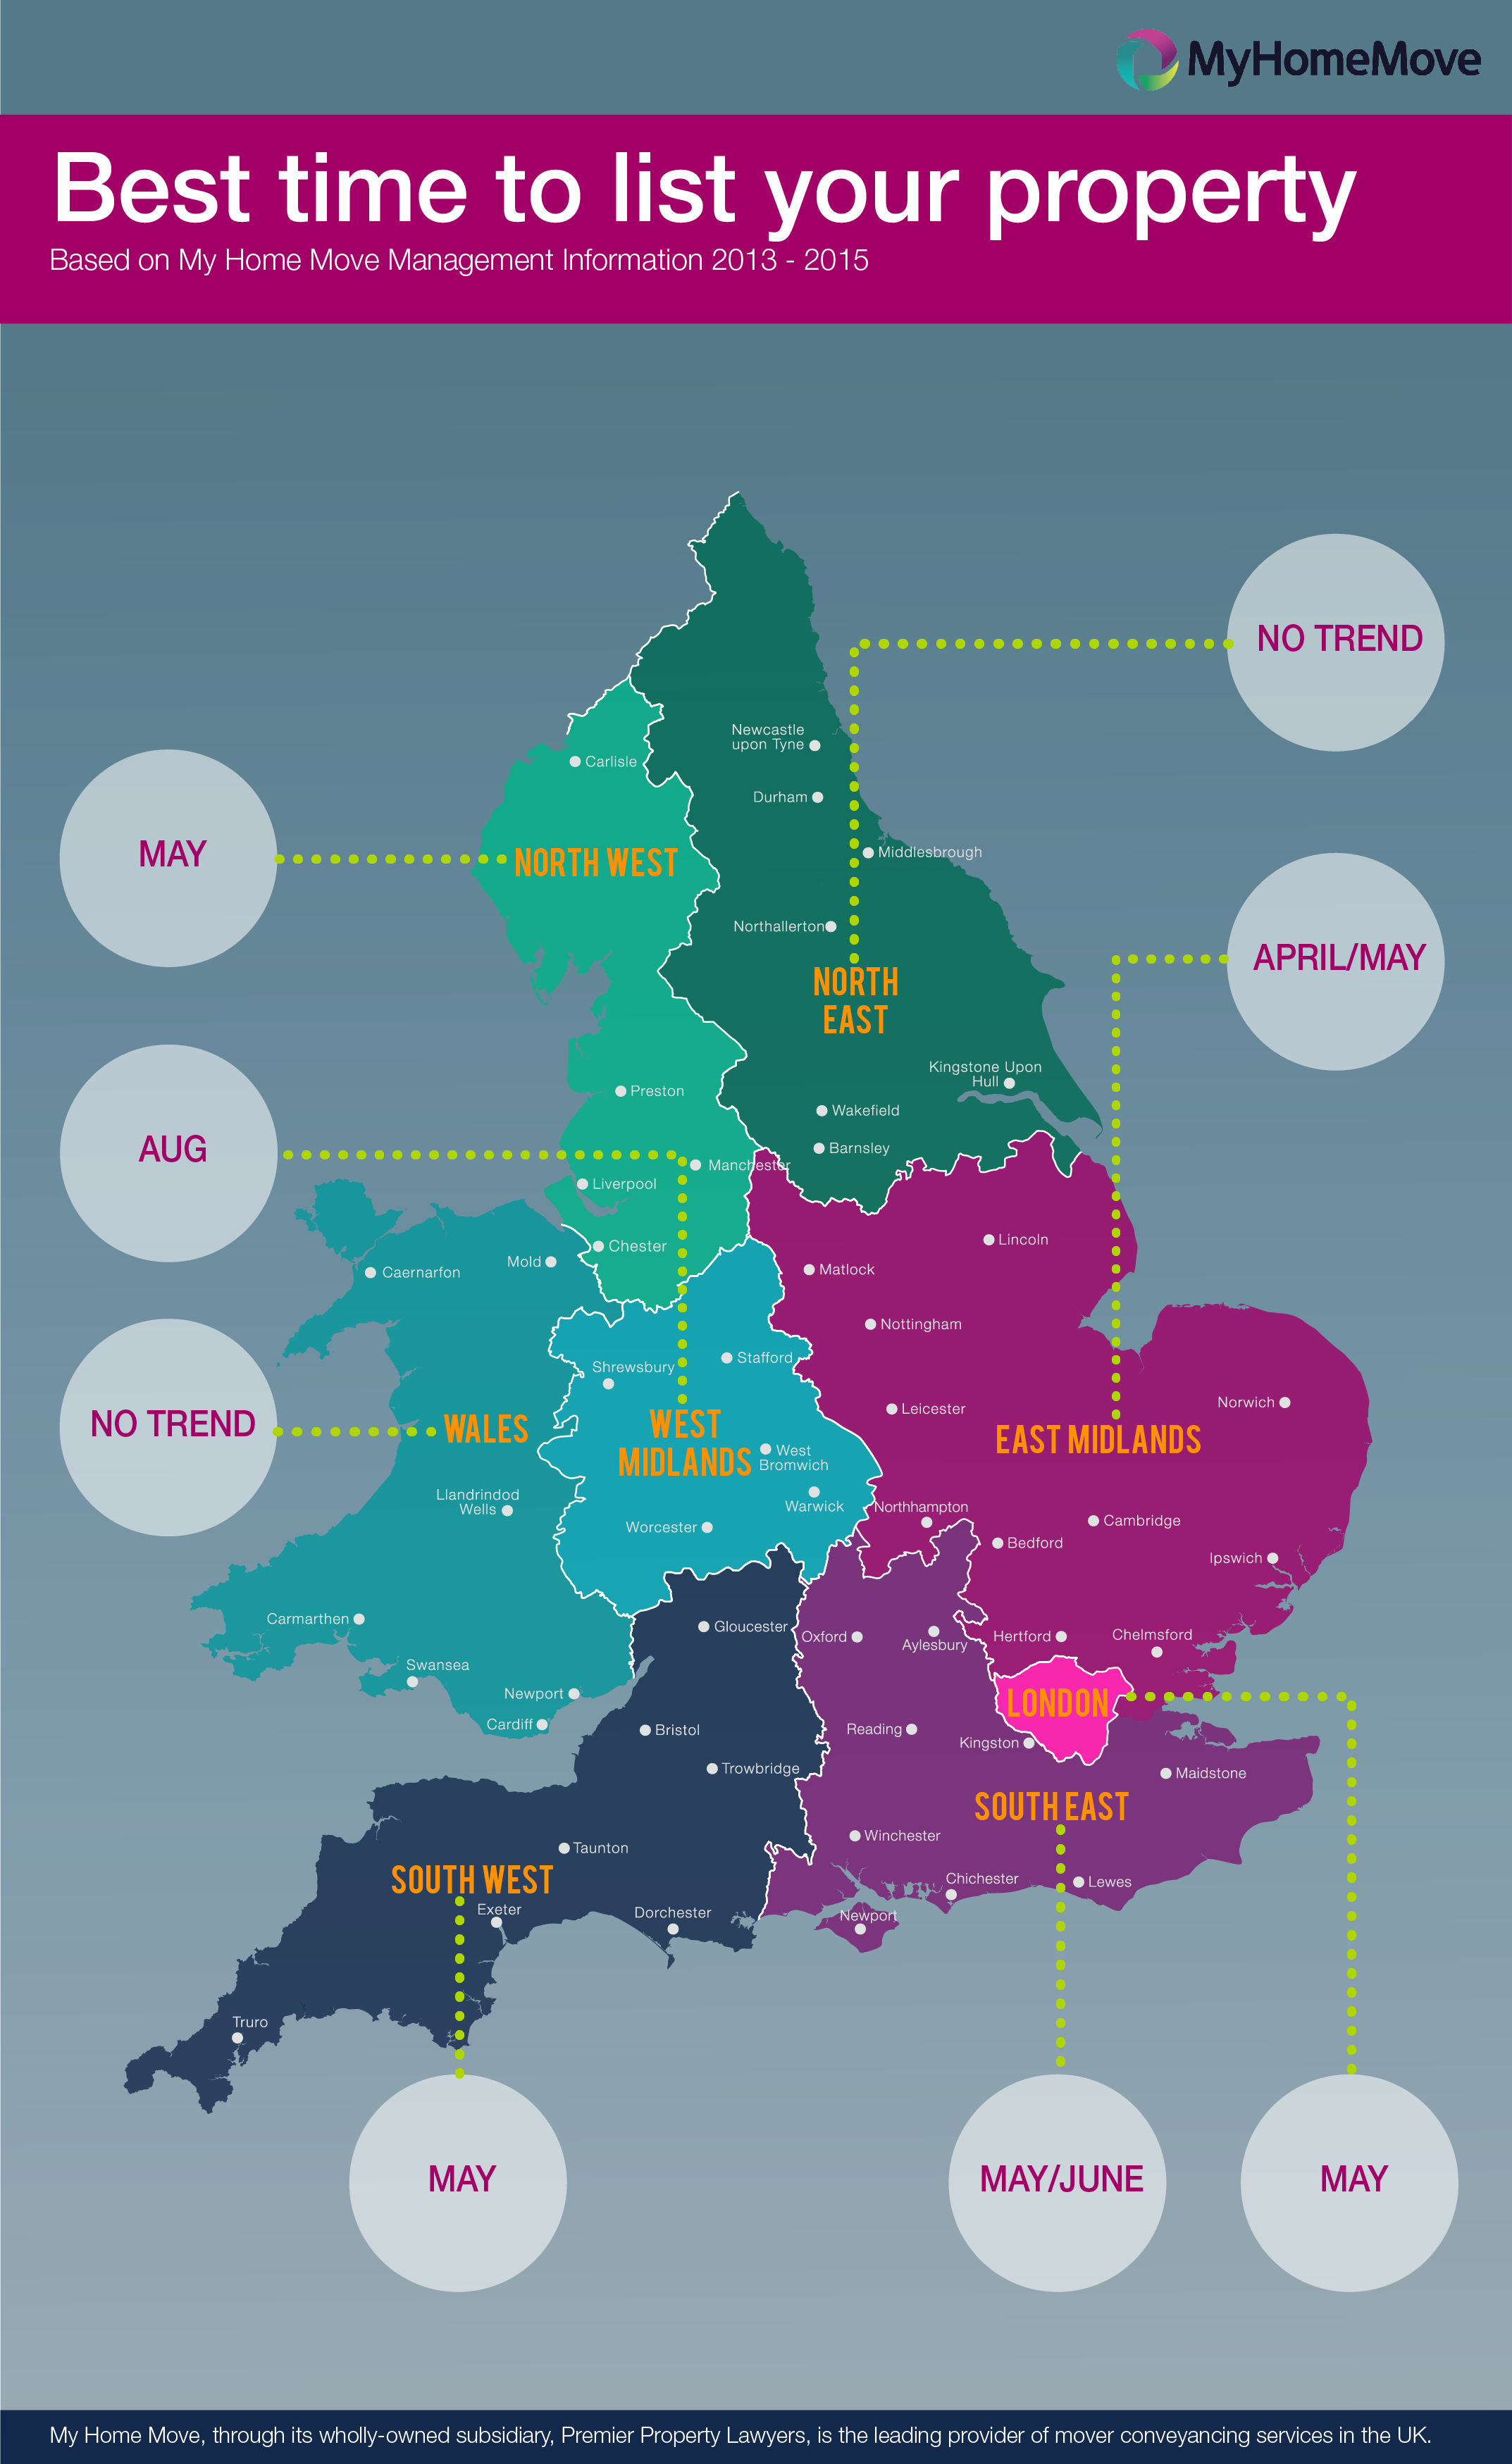
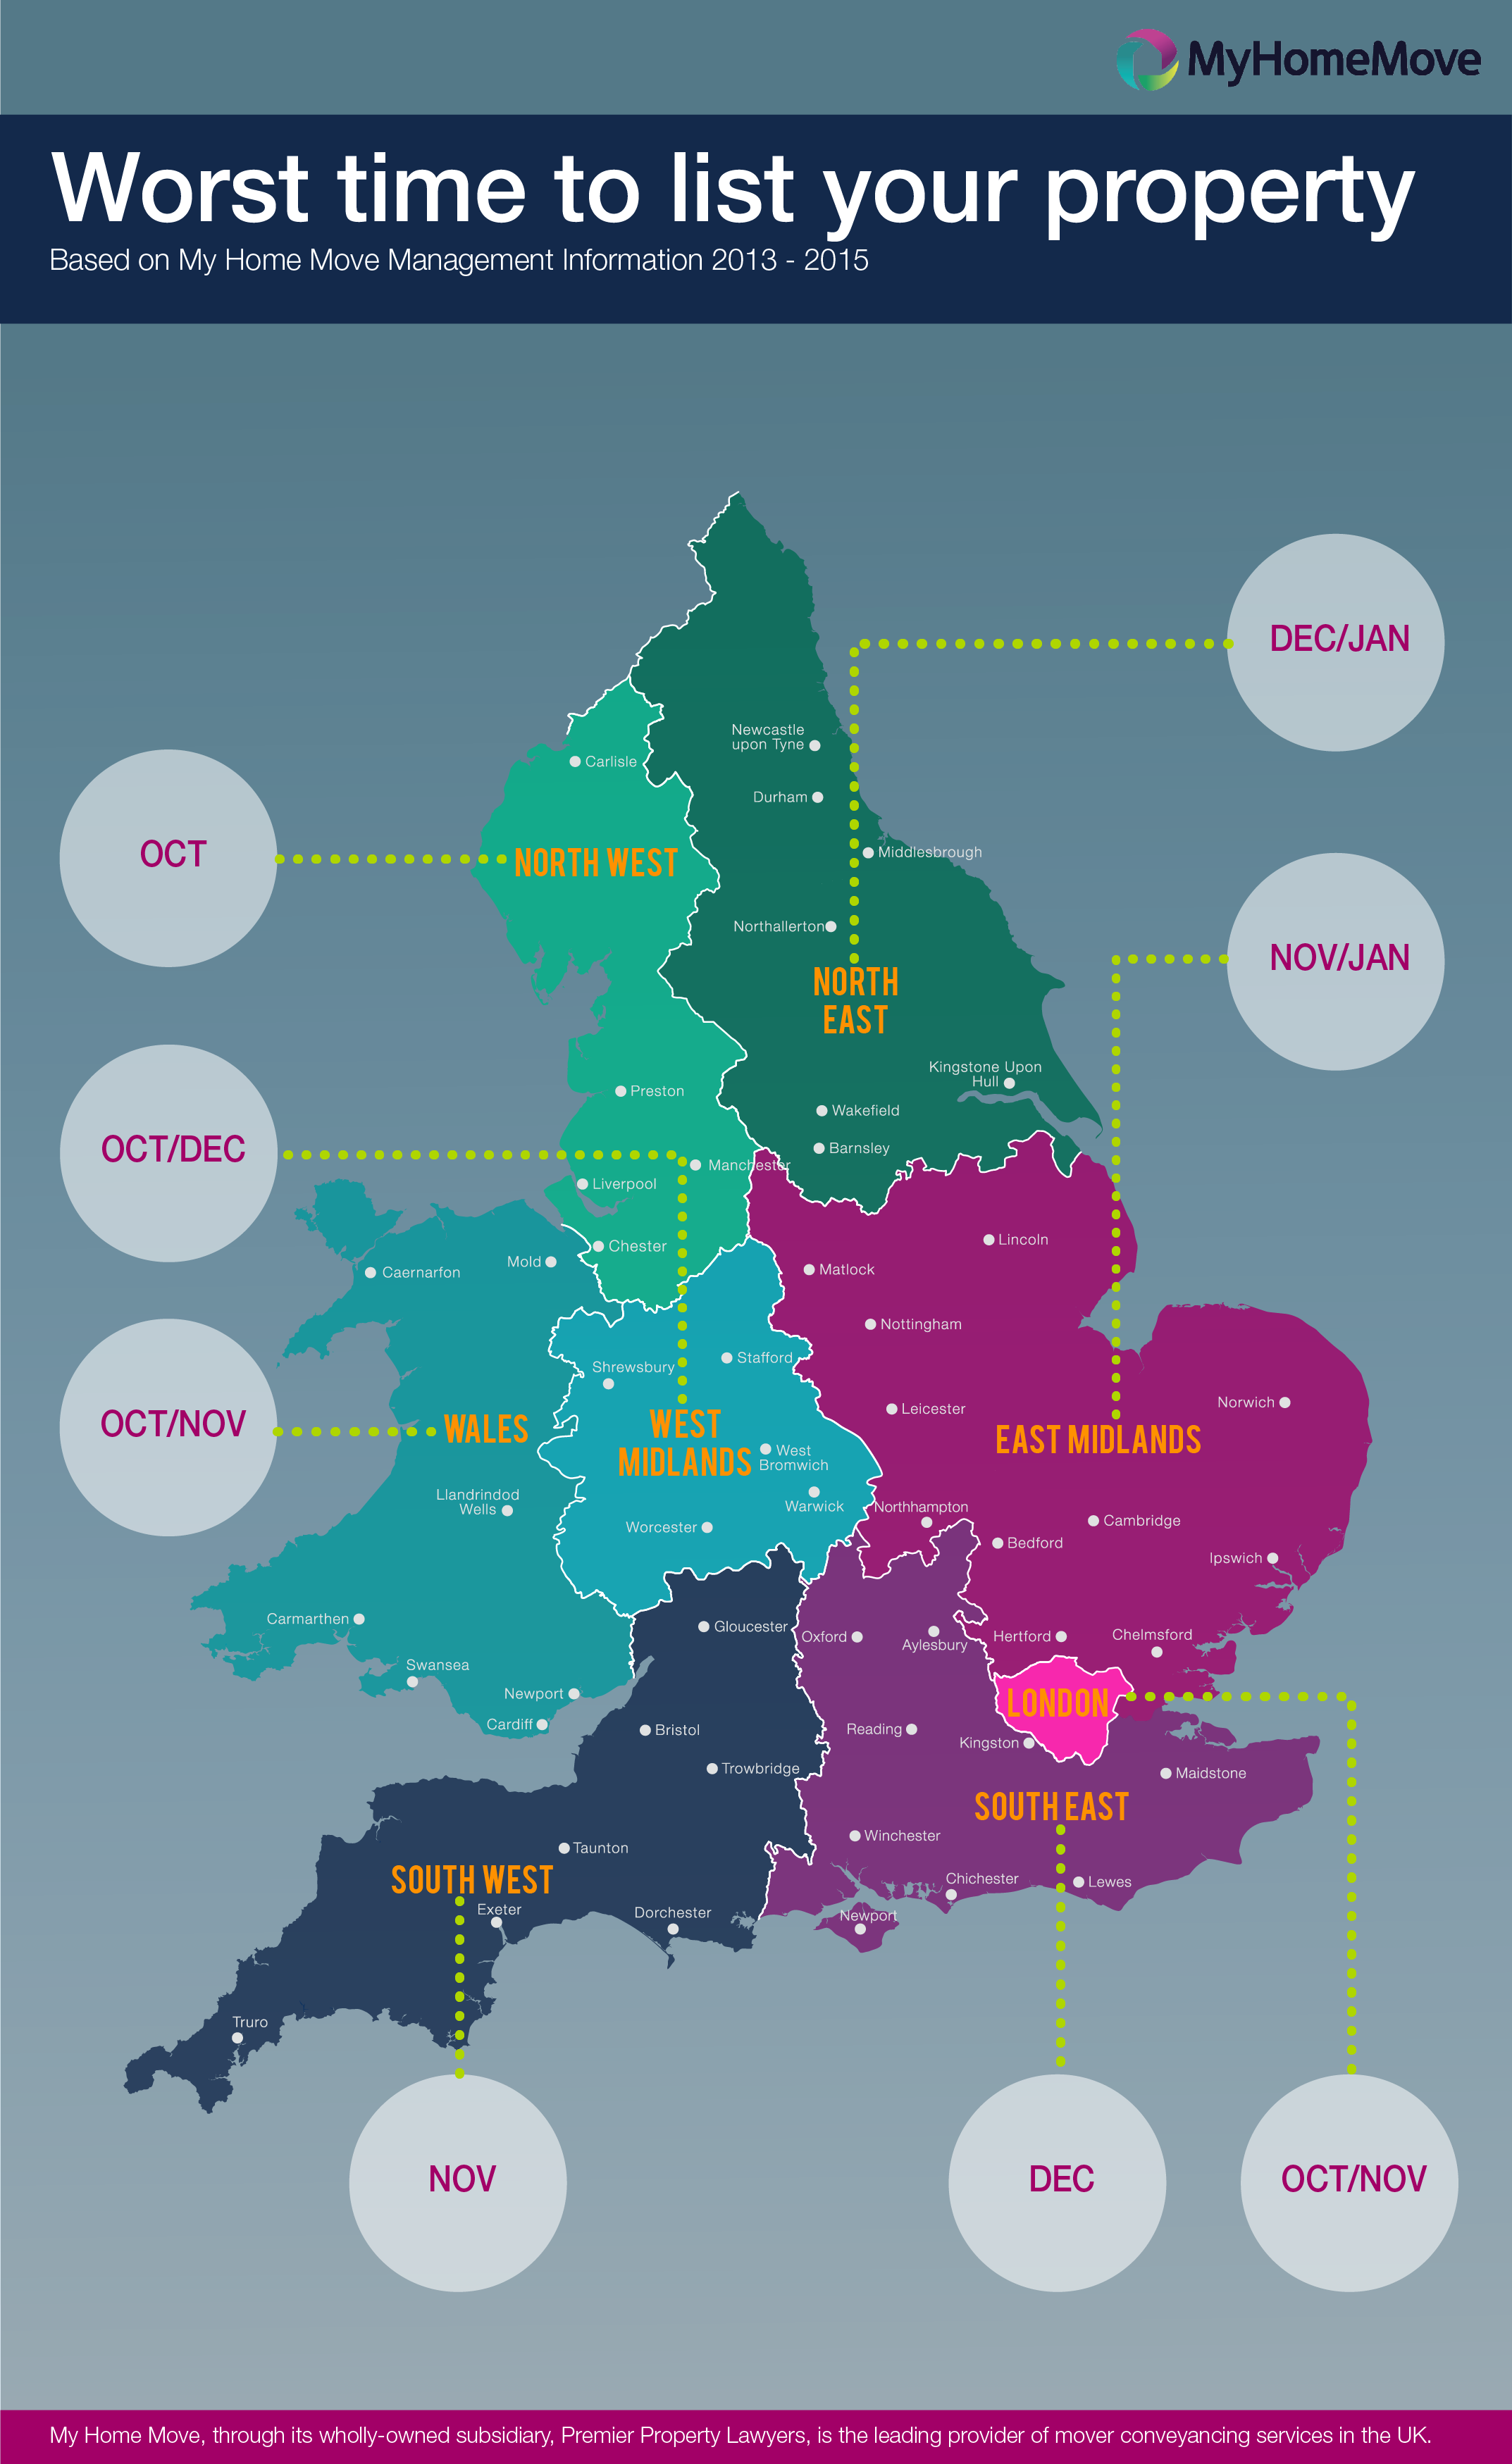
Continuing, Doug said: “Looking at the national picture, homes listed in May provided the best return for sellers, as the majority of top prices were recorded in August; while homes listed during the late autumn and winter months saw prices dip to their lowest point. However, if you flip this on its head, then anyone wanting to bag a bargain post-Christmas should start looking for their next home now.”
Regional variations
The South West and West Midlands proved the most consistent regions, as the highest prices were recorded in August and November respectively for the three years running, suggesting sellers should look to list their homes in May and August. However, the North East and Wales offered no clear pattern for sellers wanting to achieve a top price.
The research also showed that property prices fluctuated greatly from month-to-month within the regions. The widest variations occured in the North West, where the average price rose by 38% between January and June 2015; and in Greater London where prices rose by 22.4% between February and August 2015. In contrast, prices in Wales dropped dramatically from a high of £208,013 in October 2015 to £158,832 one month later in November (-23.6%); showing that the Welsh property market is bucking the trend and following its own rules.
Commenting further, Doug said:
“As we know, the 2015 property market was dominated by the issues of supply and demand and while this has largely worked in the seller’s favour, it has also resulted in some regions experiencing a feast or famine scenario in terms of sale prices. Wales, the North West and Greater London have all seen prices roller-coaster over the year; and presently there is little to suggest 2016 is going be any different as the lack of housing stock has yet to be resolved.”
*Methodology – for 16 week listing/conveyancing time.